Ever wondered if those crypto charts might be the key to smarter trading? Think of technical analysis as your friendly guide that turns messy market numbers into a clear sign. It’s a bit like turning a jumble of puzzle pieces into a picture that even beginners can understand.
In this post, we chat about using simple chart tools and important markers to figure out why prices jump around. Imagine looking at a chart that shows you the beat of a market day, each line and dip tells you a part of the story.
We keep things plain and friendly. Even when the market feels wild, we show you how to read those numbers and make confident moves. Get ready to find clear insights that could help you feel more on top of your trading game.
How to Apply Cryptocurrency Technical Analysis: A Step-by-Step Process
When you follow a clear, step-by-step method, raw crypto data transforms into a helpful guide for your next move. It’s like following a simple recipe, each step builds on the last so you can uncover real market trends without second-guessing yourself.
-
Choose charting platform and asset
Begin by picking a trusted charting tool and the crypto asset you want to study. For example, choose a platform that offers clear charts and live price updates so you can feel confident in your analysis. -
Define timeframe and data range
Next, decide on the timeframe that fits your trading style. You might use daily data to spot longer trends or zoom in with minute-by-minute details if you prefer short-term trades. This sets the stage for noticing the subtle shifts in market activity. -
Draw key support and resistance lines
Look back at past highs and lows to find the important price levels. Picture drawing a line where the price typically rebounds or falls back, these lines become the essential markers in your chart analysis. -
Apply primary indicators (like moving averages and RSI)
Add in key indicators to give your analysis a solid backbone. Moving averages help smooth out the price swings, and the RSI offers a peek into whether the market might be overbought or oversold. It’s a practical way to combine numbers with a clear picture of the market’s pulse. -
Set alerts and review trade signals
Finally, set up alerts so you’re automatically notified when prices reach your key levels or when an indicator shifts significantly. This approach keeps you informed without having to stare at the screen all day, letting you focus on making smart trading decisions.
By making these steps part of your daily routine, you build a steady and disciplined approach to trading. Each day, as you review your charts and adjust to changing market conditions, those technical signals become clear, actionable insights that empower you to make better trading choices.
Chart Patterns and Formations in Cryptocurrency Technical Analysis
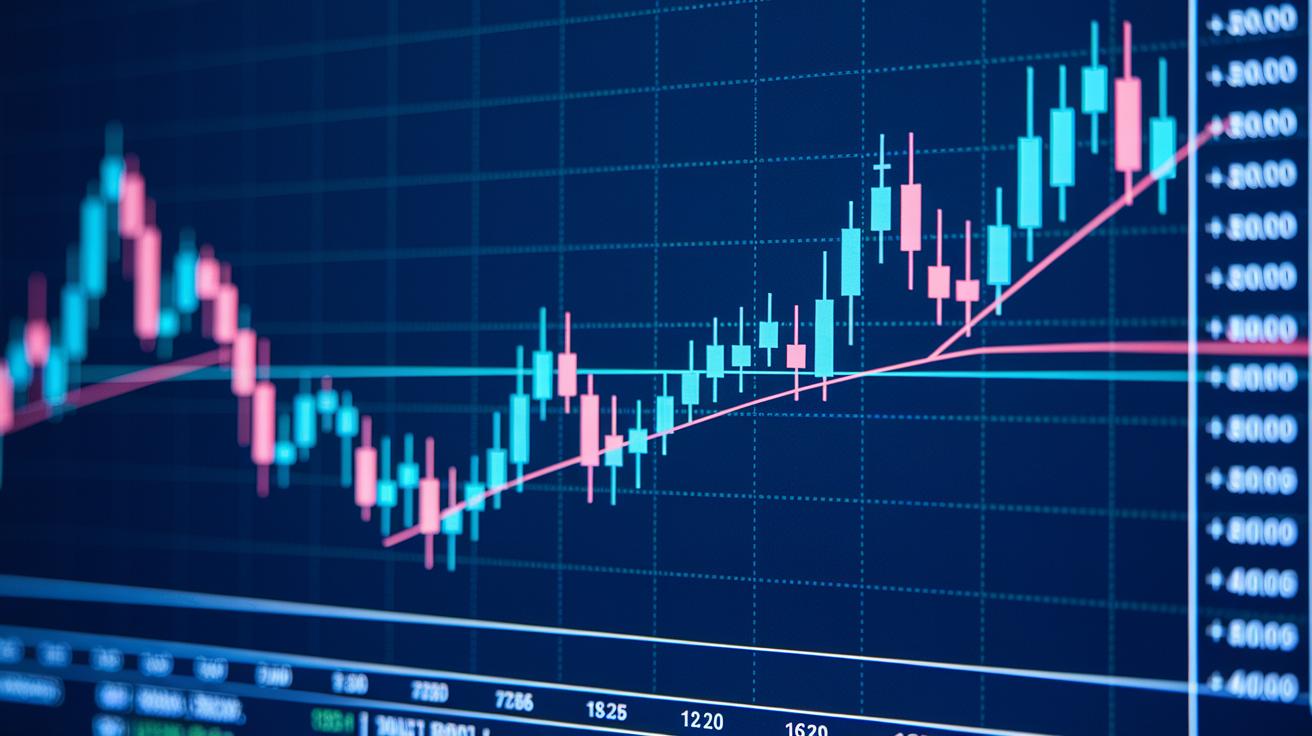
When you dive into crypto charts, you’ll notice familiar patterns that hint at whether prices might go up or down. Candlestick charts, which show the open, high, low, and close, set the stage for spotting these clues that help you understand market trends.
Head and Shoulders
Imagine a chart with a left peak, a taller peak in the middle, and then a right peak that mirrors the first one. The line connecting the lows, known as the neckline, acts like a support line. When prices slip below this line, it can be a sign that the market may turn bearish. For example, if the price drops sharply after forming that right peak, it’s a clear cue to proceed with caution.
Double Tops and Bottoms
These setups occur when you see two similar peaks in a rising market or two similar dips in a falling market. Often, you’ll also notice a drop in trading volume, which adds to the pattern’s reliability. Traders then measure the distance from the high (or low) to the neckline, giving them a practical target for when to enter or exit a trade.
Triangles and Pennants
Triangles, whether ascending, descending, or symmetrical, signal that prices are consolidating, as if taking a short break. Pennants are similar patterns but appear over a shorter time. The direction in which prices break out from these formations often points to the next big move, helping you plan your trades with more confidence.
When you mix these pattern breakouts with other tools, you can spot clear signals for when to jump into or leave a trade, making your trading strategy more robust.
Key Technical Indicators for Cryptocurrency Technical Analysis
Indicators are essential tools in crypto analysis. They take raw data and turn it into clear signals that help you decide when to trade. In simple terms, they mix numbers with visual cues to highlight market momentum and hint at possible reversals.
Moving Averages & MACD
Moving averages, whether simple or exponential, smooth out price changes so you can see the overall trend. They update with every new price point, making them reliable for tracking real-time moves. MACD works a bit differently by using two moving averages: one for the MACD line and one for the signal line. When these lines cross or the histogram shifts, it could mean the market is about to change direction. For example, if the MACD line moves above the signal line, that might be a cue to buy.
RSI & ADX
The Relative Strength Index (RSI) is measured on a scale from 0 to 100, with a common period setting of 14. Generally, a reading above 50 shows buying strength, while one below 50 suggests selling pressure. ADX adds another layer by measuring how strong the trend is. When ADX is over 25, it signals that the current trend might be pretty robust, helping you confirm that the RSI’s reading matches the market’s pulse.
OBV & Awesome Oscillator
On-Balance Volume (OBV) tracks the flow of volume by giving weight to upward and downward moves, offering a glimpse into the trading volume behind price changes. The Awesome Oscillator (AO) compares momentum to a zero line. When AO moves from negative to positive, it hints at rising buying pressure, and when it drops, it might indicate growing selling sentiment. These shifts help traders decide whether to adjust their positions.
Fibonacci Pivot Points & Parabolic SAR
Fibonacci pivot points are calculated using the previous high, low, and close to provide potential reversal levels on your chart. On the other hand, the Parabolic SAR places dots along the trend. Once these dots flip, it’s a signal that the momentum might have shifted.
Using several indicators together can boost your confidence and help you paint a fuller picture of what’s happening in the market.
Trend Analysis and Price Action Signals in Cryptocurrency Technical Analysis
Start by drawing clear trend lines. It’s like turning scattered data into a simple map that shows the market’s direction. When you connect swing highs or swing lows, these lines act as guides. Imagine linking local peaks to form a line that hints at selling pressure or drawing upward swings that signal a bullish mood. It’s a bit like outlining a landscape so you can see its shape clearly.
Watch for patterns like higher highs and higher lows. They offer friendly clues about momentum. When prices break through key levels, say, a resistance that’s held for a few sessions or a support line that suddenly crumbles, it’s like a nudge telling you that a change is coming. A breakout often means buyers are stepping in, while a breakdown shows that sellers are taking over. It’s a handy signal for figuring out when to jump in or pull back.
Sometimes, you’ll spot a mismatch between the price and tools like RSI or MACD. Mix in a noticeable volume spike, and you might be witnessing the early signs of a reversal. It’s almost like sensing a shift in the air, a subtle hint that things could soon change.
Using Support, Resistance, and Fibonacci in Cryptocurrency Technical Analysis
When you start using support and resistance, you first look at past highs and lows. These clear horizontal lines show you where prices have turned around before, kind of like a finish line where every race has its turnaround.
Next, you add Fibonacci retracement levels. These key percentages, 23.6%, 38.2%, 50%, 61.8%, and 78.6%, are overlaid on your chart. They help you figure out where a price move might slow down or reverse. So, if a cryptocurrency shoots up and then pulls back toward the 38.2% level, it might be a good time to consider an entry. On the flip side, if prices near the 61.8% level, you might want to proceed with caution.
Pivot points, which are based on previous highs, lows, and closing prices, also add value by showing potential intraday turning points. And there’s the Parabolic SAR, a tool that flips sides when trends reverse, giving you extra clues about when things might shift.
Pulling support, resistance, and Fibonacci levels together creates a smart, cohesive strategy. When a horizontal line meets a Fibonacci retracement, it strengthens the signal, helping you make more reliable entry and exit decisions in these fast-moving markets.
Tools and Platforms for Real-Time Cryptocurrency Technical Analysis
Picking the right platform really makes a difference. A solid tool lets you act fast by tracking live price changes and catching market signals as they unfold. It gives you up-to-date data every moment, so your analysis stays sharp and reliable.
Today’s crypto charting systems are packed with features that suit active traders. They offer live market charts that keep you connected to every twist and turn of price action. And with built-in drawing tools, you can quickly mark trend lines, identify support and resistance levels, or sketch out Fibonacci zones to shape your strategy. You might even set an alert to buzz when the RSI hits an important level or when a moving average shifts direction. Some platforms go the extra mile with order-book views, heatmaps, and back-testing functions that let you check past performance and fine-tune your approach.
When you're comparing options, look at the user interface, the speed of data updates, and how much you can tweak the settings. Make sure the drawing tools feel intuitive and the alerts are flexible enough to match your trading style.
Final Words
In the action, we walked through a clear, step-by-step guide to set up charts, identify chart patterns, and use key indicators. We explored drawing support levels, reading trend lines, and applying tools like Fibonacci retracements. Plus, we examined choosing platforms that provide real-time data to keep you updated. This clear process sets you up to track trends and adjust strategies every day. Embracing cryptocurrency technical analysis can boost your confidence, helping you pursue financial growth and stability with a warm, informed approach.
FAQ
Frequently Asked Questions
What is cryptocurrency technical analysis PDF?
A cryptocurrency technical analysis PDF provides a downloadable guide that explains key concepts like chart patterns and technical indicators. It offers clear steps to help traders grasp market trends and make informed decisions.
What is a cryptocurrency technical analysis book?
A cryptocurrency technical analysis book details how to use charts, support/resistance levels, and indicators. It serves as a practical guide for both new and experienced traders to enhance trading strategies.
What do cryptocurrency technical analysis charts show?
Cryptocurrency technical analysis charts show past price movements with visual tools like candlestick displays. They highlight trends, support/resistance zones, and potential reversals, offering traders insight into market behavior.
What is crypto technical analysis for beginners?
Crypto technical analysis for beginners explains basic chart reading and indicator use in straightforward terms. It simplifies complex market data so newcomers can start recognizing patterns and trends easily.
What is a crypto fundamental analysis website?
A crypto fundamental analysis website examines a coin’s underlying value by reviewing project details, team credibility, and market potential. It complements technical analysis for a well-rounded view of the market.
Is there a crypto technical analysis app available?
A crypto technical analysis app provides real-time charts, drawing tools, and alerts on your mobile device. It lets traders monitor market trends and execute strategies conveniently while on the move.
Does technical analysis work in crypto markets?
Technical analysis works in crypto markets by studying past price data and using patterns to signal trends. Although it does not guarantee success, it helps traders better understand and predict market movements.
Which analysis is best for cryptocurrency?
The best analysis for cryptocurrency combines technical analysis for spotting trends with fundamental analysis that reviews a project’s strengths. This blend gives traders a more comprehensive view of market opportunities.
How do you analyze cryptocurrency?
Analyzing cryptocurrency involves reviewing price charts, drawing trend lines, and applying indicators like moving averages. This approach helps traders assess market trends and potential entry or exit points.
What are the three types of crypto analysis?
The three types of crypto analysis are technical analysis, fundamental analysis, and sentiment analysis. Each method examines market behavior from different angles to help traders make balanced decisions.
Which platforms offer reliable cryptocurrency technical analysis tools?
Platforms such as TradingView, Binance, Coinbase, and Bybit offer reliable technical analysis tools. Educational sites like Investopedia and eToro also provide resources to help traders understand and use these tools effectively.