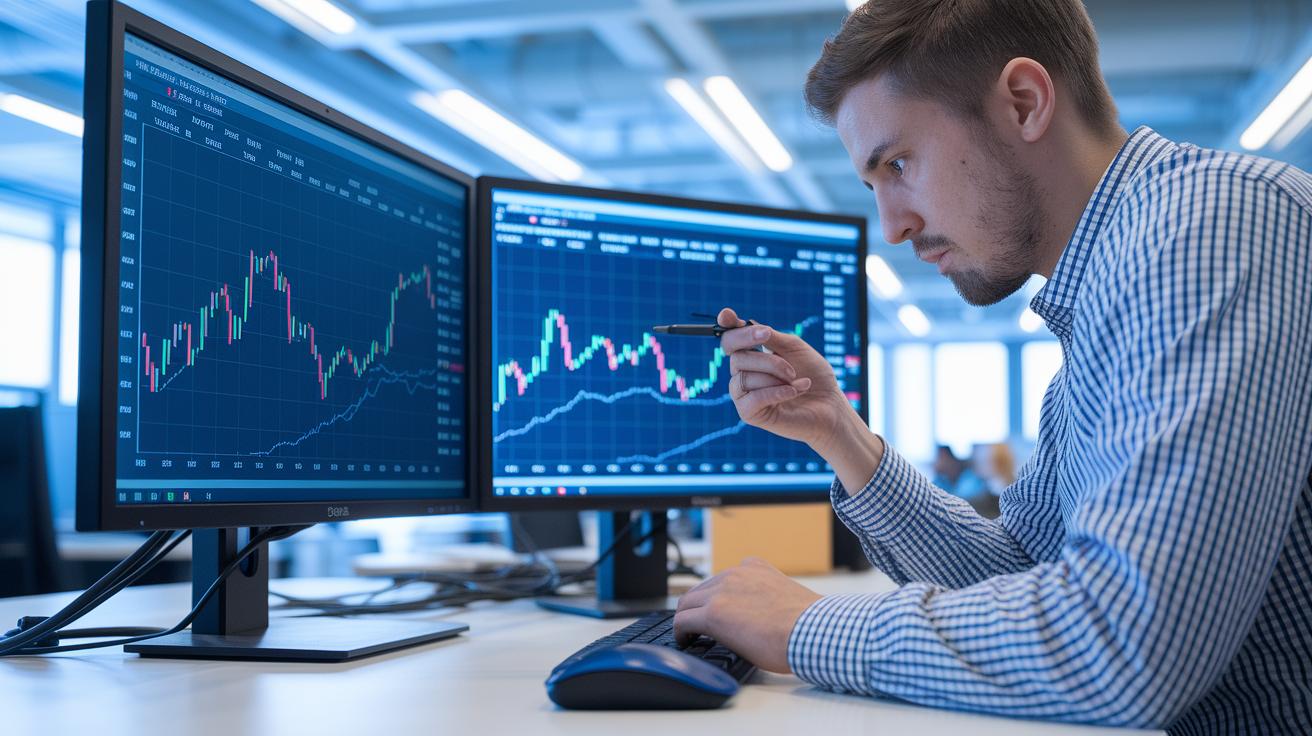
Ever feel like your trading tools might not be pulling their weight? Smart Market Picks walks you through some platforms that make tracking prices a breeze. They offer real-time charts so you can see price changes as they happen, spot trends with simple pattern detection, and even tap into advice from fellow traders.
It’s pretty neat, you can stick to your plan without getting stuck fiddling with complicated software. Imagine spending less time wrestling with tech and more time catching those exciting market moves. Whether you’re just starting out or you’ve been trading for years, this post shows you how each platform can make your trading life smoother and more efficient.
Essential Platforms for Technical Analysis Tools
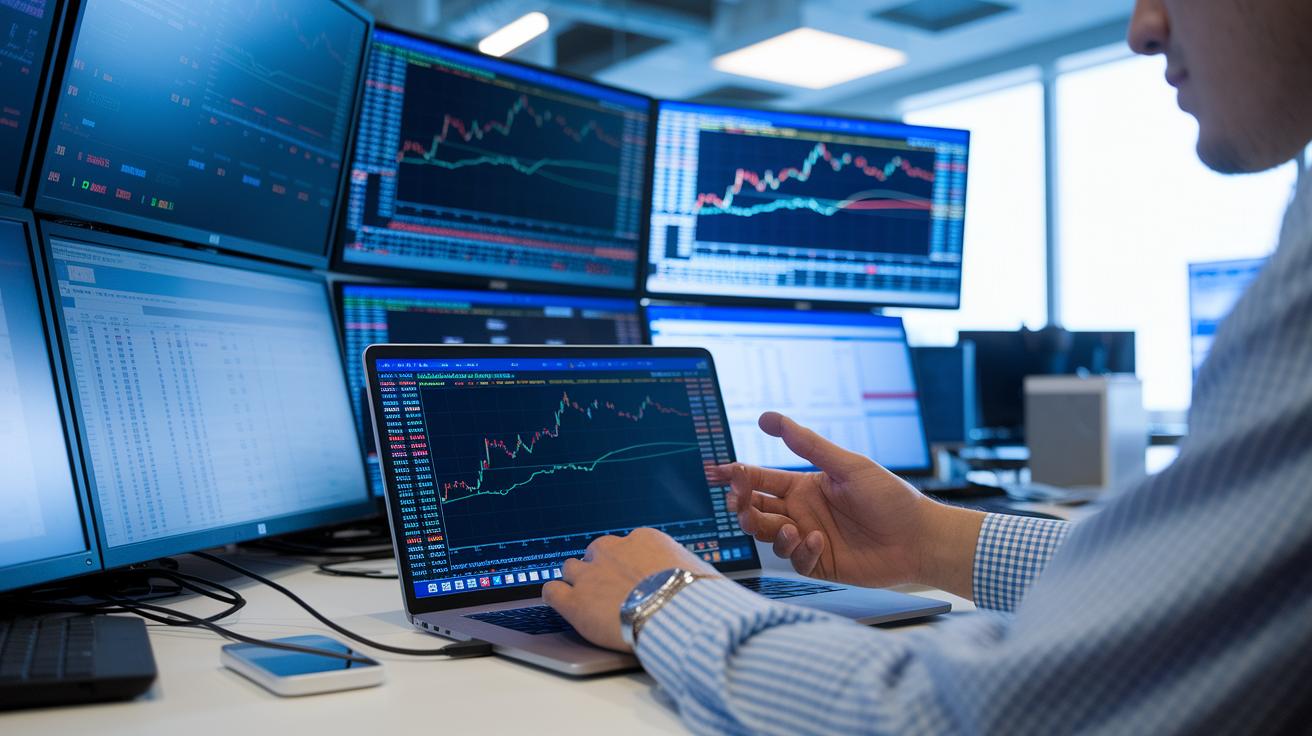
When you’re ready to trade, you need tools that help you hit the ground running. Platforms like ProRealTime Technology, TradingView, TrendSpider, and MetaTrader make it easy by offering ready-to-use charts, quick pattern detection, and setups you don’t have to code. This means less hassle with endless tabs or unwanted upgrades, so you can catch every market move as it happens.
These tools do more than just help you enter orders. They let you customize your experience like no typical charting software does. For example, TradingView is awesome if you want to see live ideas from an active community of traders, imagine scrolling and discovering trade setups without ever leaving your screen. And if you’re a DIY type, MetaTrader’s open-source options let you create custom indicators that adapt as the market changes.
| Platform | Charting Features | Pattern Recognition | No-Code Analysis | Community Insights |
|---|---|---|---|---|
| ProRealTime Technology | Advanced real-time updates | Automated pattern detectors | Simple drag-and-drop functionality | Peer review tools |
| TradingView | Interactive charting | Built-in scanners | User-friendly interfaces | Vibrant community features |
| TrendSpider | Streamlined analysis | Visual pattern recognition | No-code setup options | Automated alerts |
| MetaTrader | Customizable chart modules | Script-based patterns | Open-source tools | Market sentiment feeds |
Each platform is built to simplify technical analysis. Imagine being free from setup headaches and focusing only on your strategy. One trader even said, "I was drowning in browser tabs until these platforms streamlined my workflow." Now, you can catch trade opportunities as data flows in and shift your focus to what really matters, your strategy.
Interactive Charting Software for Technical Analysis Tools
Interactive charting software gives traders more hands-on control with advanced customization. You can create custom indicator scripts that pick up on tricky market signals, like matching moving averages with changes in volume. Imagine a trader saying, "I set my script to alert me when small price shifts happen – it gives me real-time, actionable insights."
New pattern scanners have become smarter by looking past simple shapes. They use refined algorithms to detect complex, multi-part patterns that the usual head-and-shoulders or triangle models might miss. This means you get a clearer, more dynamic view of the market as it changes.
Indicator libraries have grown even better, too. Updated drawing tools such as trendlines and pivot-point markers refresh instantly, helping you see live changes in the data. It’s like watching raw numbers transform into a vibrant, real-time story of the market.
Automated and Algorithmic Tools for Technical Analysis
Using no-code and script-based engines, traders can quickly check how their strategies would have fared with past price data. Picture setting up your system to run loads of "what-if" tests to gauge how your plan might perform during wild market swings. I even recall a time when a script I set up spotted a strong momentum shift and flagged a breakout just before it happened.
These tools send automatic alerts so you know when to jump in or back out, saving you from staring at charts every minute. Smart, AI-powered chart tools can detect differences and sudden bursts in market activity, sending you real-time signals. Plus, machine-learning models watch price trends and pick up on any unusual mood shifts in the market, giving you a little extra confidence before you act on a trade.
Open API frameworks let you smoothly blend your system with platforms like AlgoTrader. This means you can run fully automated trade checks right within your current setup. Customizable charts allow you to line up all your indicators and alerts on one screen, which cuts out the clutter and helps you stay focused.
- Each feature turns manual work into a repeatable, data-backed process.
- Automated alerts lower the chance of human mistakes.
- Integration with proprietary code libraries supports a trading setup that can grow with your needs.
Backtesting and Strategy Testing Tools for Technical Analysis
Think of backtesting platforms as a trial run for your trading ideas. They let you load detailed price data, whether it’s every tick or daily open, high, low, close data, to see how different market conditions would have affected your strategy. These tools can calculate key figures like the Sharpe ratio (a measure comparing your return to its risk) and your worst losses. They basically replay past charts so you can watch your trading plan in action as if it were live.
With built-in features, you can fine-tune your plans by testing different ways to enter and exit trades. Imagine saying, “I backtested my system and saw a 45% boost in managing risk during market drops.” It shows how digging into past data can build your confidence before putting your money on the line.
| What You Can Do | Description |
|---|---|
| Import Historical Data | Load everything from minute-by-minute ticks to daily summaries. |
| Run Stress-Tests | Test your strategy across different market cycles to see how it holds up. |
| Compare Performance Metrics | Use measures like the Sharpe ratio to guide your adjustments. |
By using these tools, you move from guessing to knowing. They help cut down uncertainty by showing potential dips in your strategy’s performance. This approach turns raw numbers into clear, practical insights that can fine-tune your trading plan and reduce risks before your real money gets involved.
Mobile and Cloud-Based Tools for Technical Analysis
Mobile tools today let you dive into full-featured charts right from your phone. Apps like thinkorswim and TradingView pack interactive drawing tools, real-time alerts, and charts that update as market data streams in. Ever gotten a text-like alert in the middle of a big price move and felt the rush to act? You're not alone.
Cloud-based apps push it even further. They sync your custom layouts and watchlists across all gadgets. Imagine tweaking your chart on a tablet while your phone buzzes with news of a market shift. These systems pull in data from stocks, forex, and crypto, merging all your feeds into one smooth experience. One trader shared, "My charts updated automatically on both my desktop and mobile, boosting my confidence when it mattered most."
| Feature | Benefit |
|---|---|
| Mobile Analysis Tools | Brings desktop-level charting to your pocket |
| Cloud-Based Apps | Syncs custom settings and layouts across devices |
| Data Feed Integrators | Merges multiple market feeds into one dashboard |
These modern tools let traders update their technical analysis on the go without losing any power or detail. If you've ever wished you could carry your desktop trading setup on your phone, this technology makes it possible, keeping you in the know with every market move.
Risk, Performance, and Data Tools for Technical Analysis
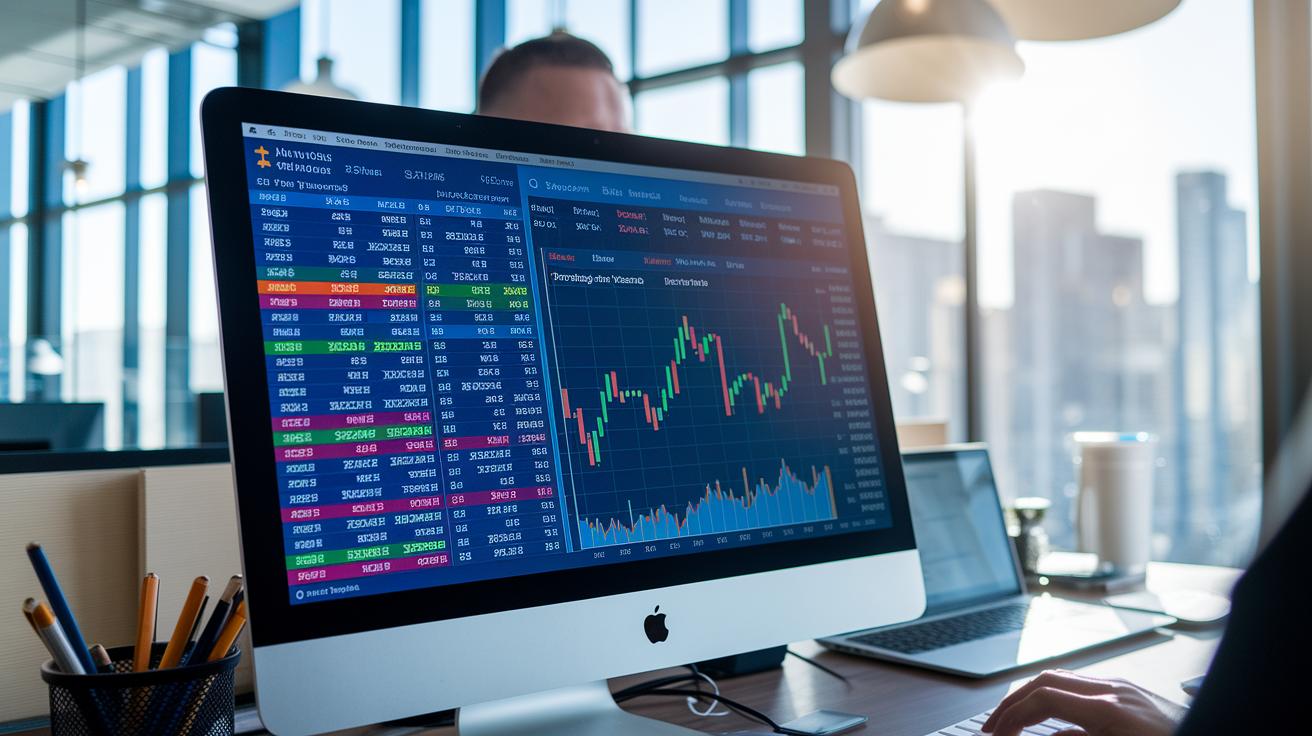
When you’re trading, having smart tools at your fingertips can really change the game. These tools do more than just show pretty charts, they give you clear numbers to help you see how your trading strategy is working. For example, a risk management calculator lets you easily figure out your position size, work out your risk versus reward, and set your margin needs. You might enter your trade’s stop-loss and target levels and see right away that your exposure is less than you thought.
Portfolio performance graphs take a jumble of numbers and turn them into a visual story of your wins and losses over time. They make it simple to spot moments when your approach was on point or needed a tweak. Ever notice how a graph can show you exactly when your strategy started to pay off?
Then there are trade volume analytics modules. These tools keep an eye on the flow of shares, letting you see when lots of trading is happening. They even link volume changes back to price movements, giving you a peek into market mood in real time.
- Risk management calculators for a clear look at your exposure
- Portfolio performance graphs that break down your profit and loss trends
- Trade volume analytics that highlight sudden shifts in the market
By mixing these data tools with solid technical signals and basic fundamental insights, you can lower your portfolio risks while turning raw market data into smart, actionable decisions.
Advanced Custom Indicators and AI Enhancements for Technical Analysis
Today’s trading platforms let you create your own edge using custom indicator tools and machine learning helpers. With easy-to-use script editors and code kits, you can build oscillators, spot shifts in volatility, and detect divergences that match your trading style. One trader said, "I built my own oscillator to catch tiny price changes, and it really helped me time my trades better."
AI-powered chart reviewers add even more insight. They watch the charts nonstop, spotting odd patterns and double-checking signals across different timeframes. They learn and adjust as market conditions change, so your tools evolve right along with you. Imagine having an extra pair of eyes that can notice a budding trend before it fully forms.
| Tool | What It Does |
|---|---|
| Custom Indicator Builders | Let you code oscillators and pattern detectors |
| Machine Learning Predictors | Examine data from many timeframes |
| AI-driven Chart Reviewers | Adapt trade signals to fit current market moves |
This method takes you way past plain, standard indicators. It turns manual chart watching into a smart, self-improving system. As the market shifts, so do your tools, giving you extra confidence to catch trade opportunities early. One trader mentioned, "My custom-coded indicators caught a surge in volatility that I wouldn’t have seen otherwise." It's like chatting with a trusted friend who always has your back in the market.
Final Words
In the action, we explored standout platforms, ranging from interactive charting to mobile apps, that give traders a clear edge. We broke down features like real-time market charting and automated study systems, making it simpler to compare their strengths.
Our review showed how these tools for technical analysis help fine-tune strategies while keeping risk in check. There's plenty of room for confident moves ahead, armed with tech that makes trading smoother and smarter. Enjoy the tools and stay ready for what the market brings next.
FAQ
Q: What free and professional technical analysis tools are available?
A: The free and professional technical analysis tools include interactive charting platforms and analysis software like TradingView, Thinkorswim, and other free applications that offer built-in buy and sell signals with real-time market data.
Q: What are the key tools of technical analysis?
A: The key tools of technical analysis include interactive charts that combine real-time data, technical indicators, and pattern scanners, which help traders identify trends and potential entry or exit points in the market.
Q: What is the 10 am rule in stocks?
A: The 10 am rule in stocks suggests that by 10 am, the early market volatility typically settles, allowing traders to better assess trends after the initial morning rush has smoothed out.
Q: What is the best tool for stock market analysis?
A: The best tool for stock market analysis varies by user needs; however, platforms like TradingView and Thinkorswim are popular for their interactive charting, real-time indicators, and user-friendly layouts.
Q: How do platforms like TradingView, Thinkorswim, Investopedia, Webull, Seeking Alpha, and Interactive Brokers support technical analysis?
A: These platforms support technical analysis by offering interactive charts, educational resources, real-time market data, and integrated analysis tools that help traders quickly interpret trends and test their investment ideas.